


FreightWaves is opening up its SONAR freight data platform, free of charge, to help carriers, shippers, and third-party logistics providers prepare for Hurricane Dorian and provide relief in its wake.
SONAR’s Critical Event Center offers unparalleled views of major weather events and information to assist companies involved in relief operations in managing their networks.
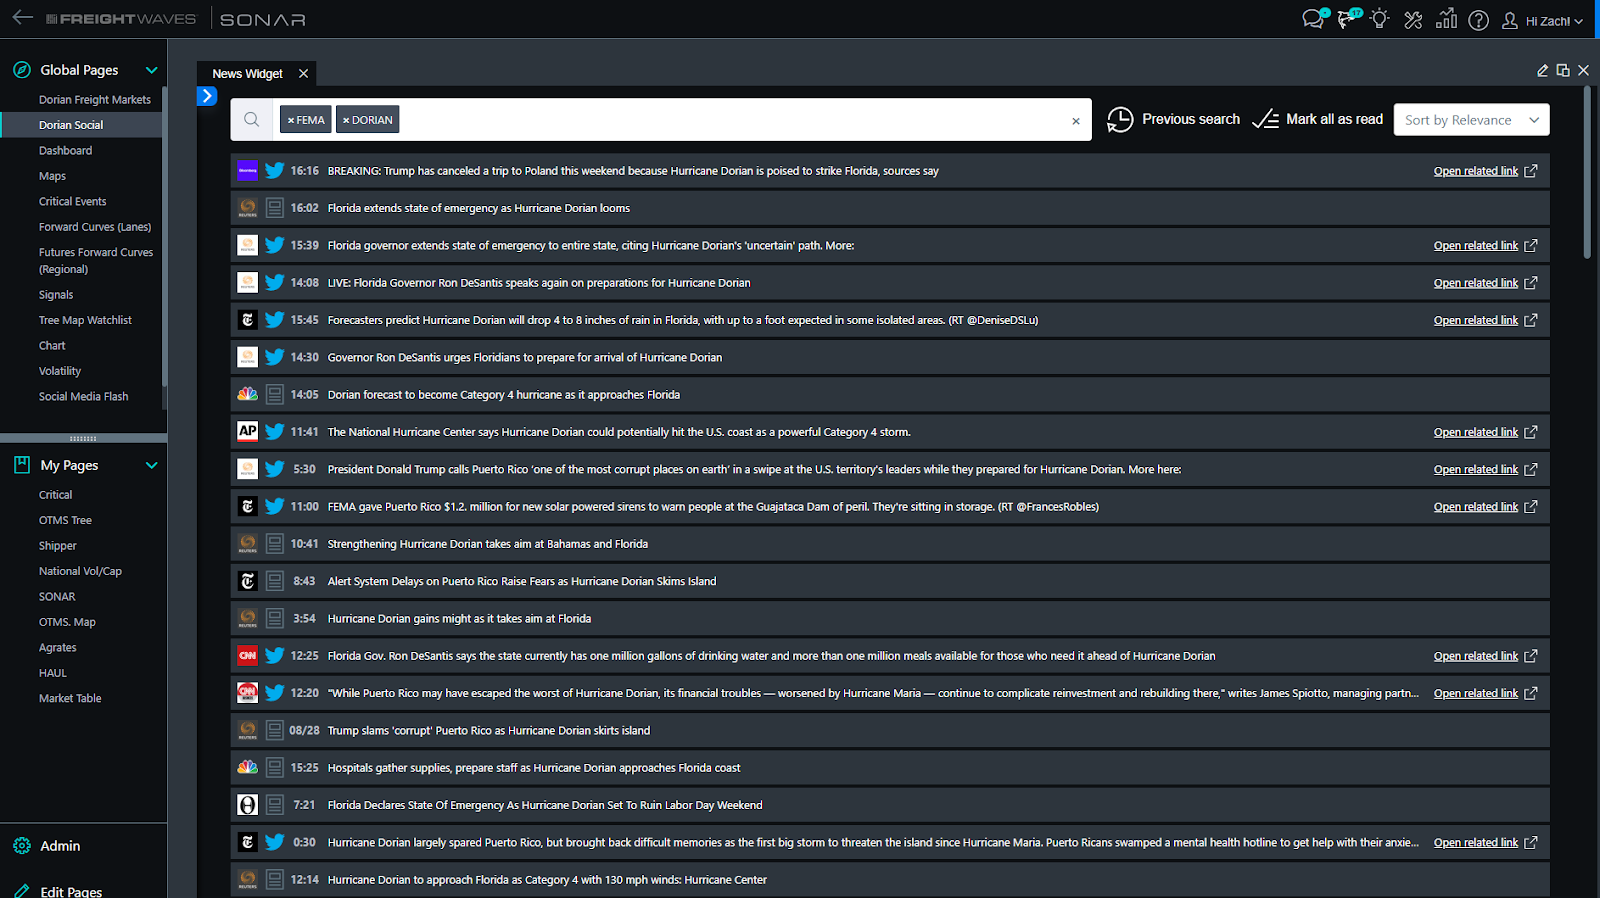
The broader SONAR platform also contains freight data from over one thousand sources that create actionable outcomes for capacity planners. There is also a direct feed from Twitter that offers filtered content from 30,000 of the most relevant news publishers, organizations, and commentators. The comments can be further filtered for specific terms around hurricanes, Dorian, FEMA, disaster relief, and over 70 other major terms.
SONAR access will be open to all for free through September 6, 2019. There is no obligation or credit card required.
“Our goal is provide the fastest data and insights on what is happening in the market to ensure that carriers, 3PLs, shippers, and first responders have the most up-to-date and relevant information in the market. I managed logistics for FEMA operations that included thousands of trucks and know how chaotic it can be. Hopefully providers will be able to utilize SONAR to make more informed decisions, track the storm and activity surrounding it, and ultimately provide faster relief services to the affected area,” Craig Fuller, CEO and Founder of FreightWaves stated.
In 2017, Fuller wrote an article about his personal experience with FEMA. Carriers and drivers that are involved in relief operations can also read this overview on what to expect in a storm.
SONAR’s Critical Events widget will be important through the planning and event monitoring. SONAR provides real-time data on Dorian’s progress and forecast, along with likely and actual impacts to transportation and energy infrastructure.
Depending on the intensity of the storm at landfall, disruptions to supply chains and freight markets could be severe. Infrastructure assets are threatened and trucking capacity will likely be absorbed by relief and reconstruction efforts.
Truckloads dispatched on relief work do not return to market at a typical rate, but instead are detained by evolving conditions, indecisive bureaucrats, and fragmentary information, often for days on end.
The ripple effect from that loss of capacity could send spot rates upward in markets as far afield as Los Angeles.
Outbound and inbound volumes can be charted by using the OTVI and ITVI tickers with a geographical qualifier (i.e., OTVI.SAV brings up outbound volumes for Savannah). Capacity tightness is measured by the outbound tender rejection rate and the OTRI ticker, which can be modified by the same geographic qualifiers; WAIT times for trucks at shipper facilities are also available for every market.
Access the SONAR Knowledge Center here to get help with the indices available in the platform.
The FreightWaves SONAR team has created Dorian-specific pages, found under ‘Global Pages’ in the menu on the left hand side of the SONAR window, which will track the key metrics for Dorian-affected freight markets.
As of this writing, those markets include Atlanta, Jacksonville, Miami, Lakeland, Mobile, Savannah and Tallahassee.
GETTING STARTED WITH SONAR
Universal, free access to SONAR will allow market participants can monitor conditions across all markets and modes, and may be extended depending on the severity of the storm.
Below, you can find definitions and explainers for the indices listed on the “Dorian Freight Markets” and “Dorian Social” pages in SONAR:
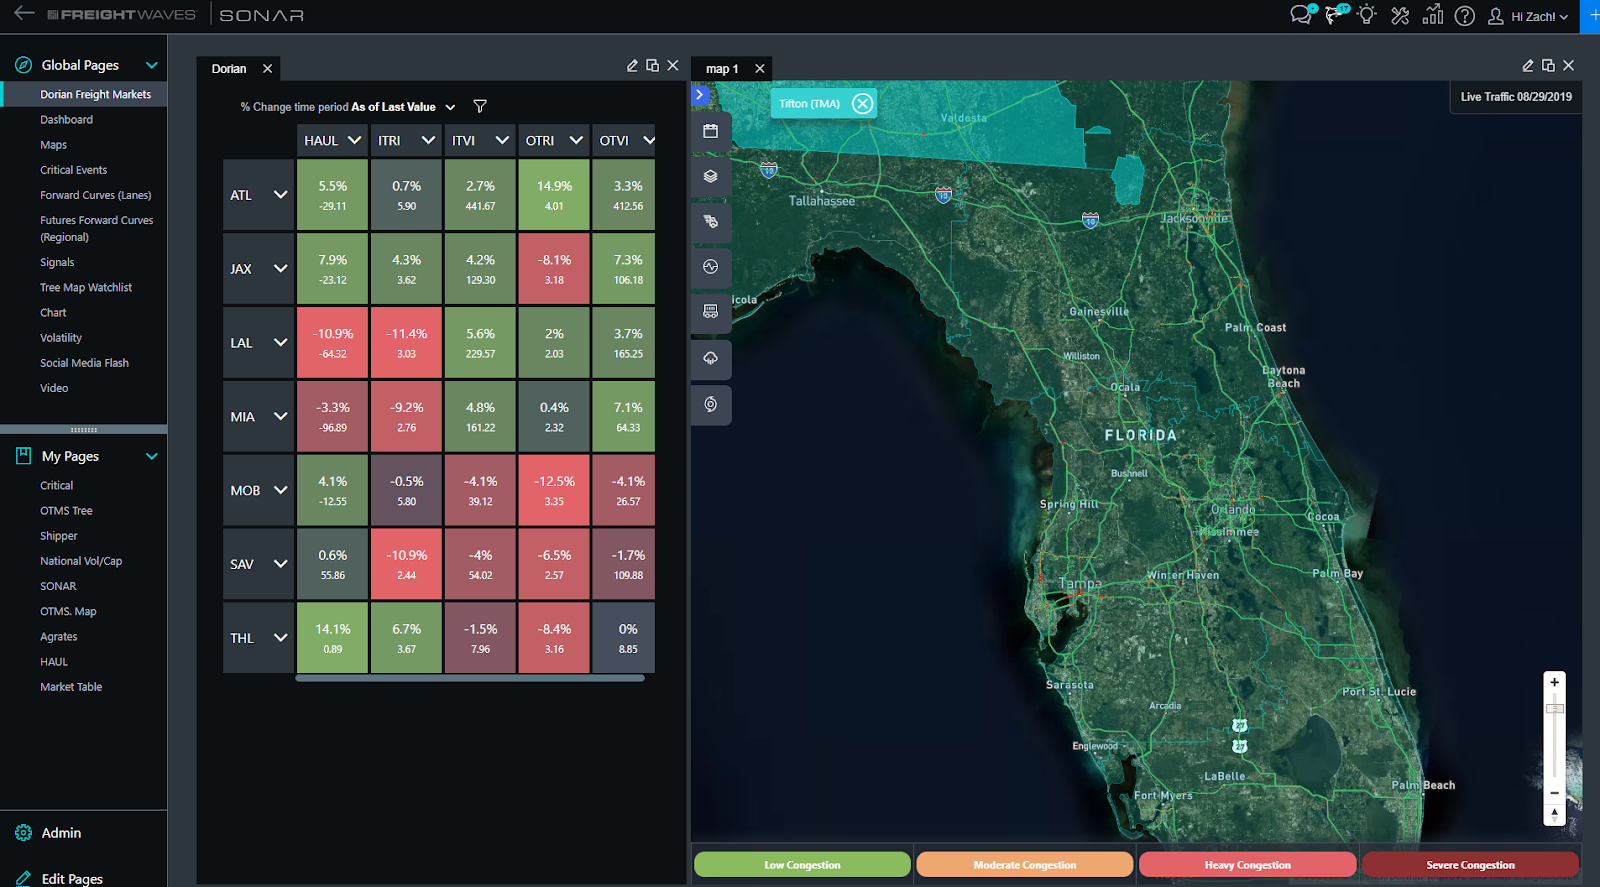
On the left side of the SONAR Dashboard under the menu item labelled ‘Dorian Freight Markets,’ there is a market activity table with the following information:
HAUL – Headhaul Index = Outbound volumes less inbound volumes. Markets with positive values are reducing truck supply faster than it can be replenished, also known as a “headhaul market.” Florida is notorious for being the opposite of this with inbound exceeding outbound, aka a backhaul market. Positive movements = increasing upward rate pressure.
ITRI – Inbound Tender Rejection Index = The rate at which carriers are rejecting inbound loads. Increasing values indicate carriers are avoiding the area and may lead to increased rate pressure.
OTRI – Outbound Tender Rejection Index = The rate at which carriers are rejecting outbound loads from a market. Increasing rejection rates correlate with higher spot rates.
ITVI – Inbound Tender Volume Index = An index measuring the amount of inbound volume for a market.
OTVI – Outbound Tender Volume Index = An index measuring the amount of outbound freight volume for a market. The higher the number the greater the demand for trucks.
The markets chosen are those in the direct forecasted path of the hurricane or have some immediate connection to the hurricane impact zones in terms of freight movement patterns.
ATL = Atlanta
JAX = Jacksonville
LAL = Lakeland
MGM= Montgomery
MIA = Miami
MOB = Mobile
SAV = Savannah
THL = Tallahassee
On the right side, there is a map with current traffic conditions where red indicates congestion and green indicates normal flow.
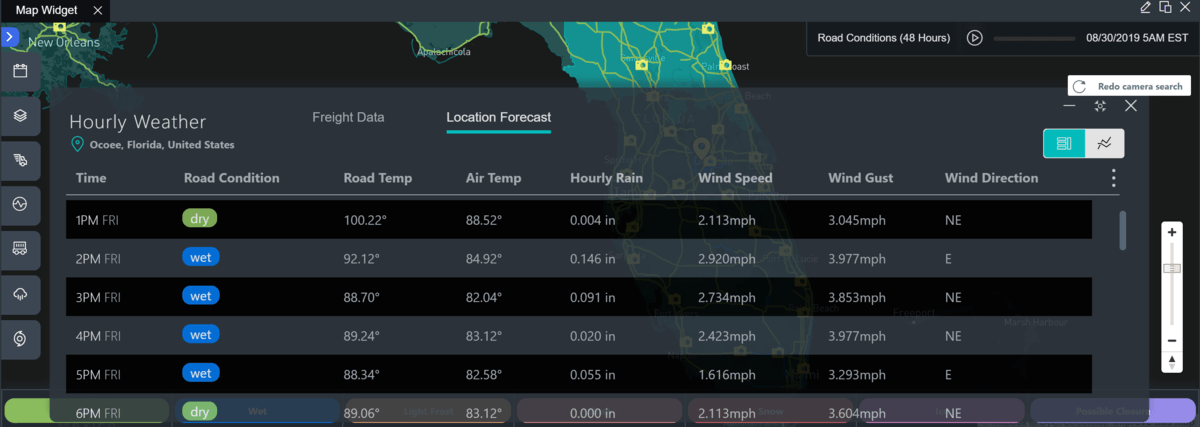
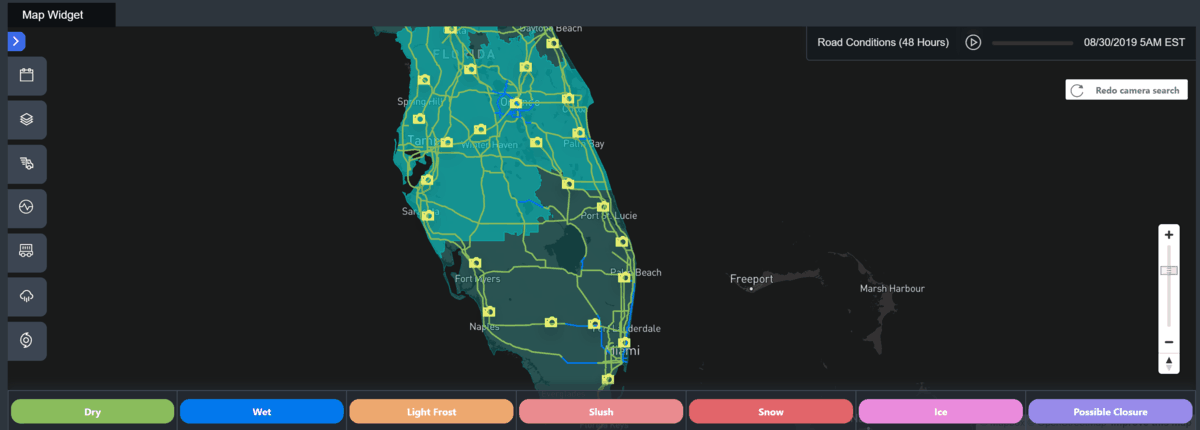
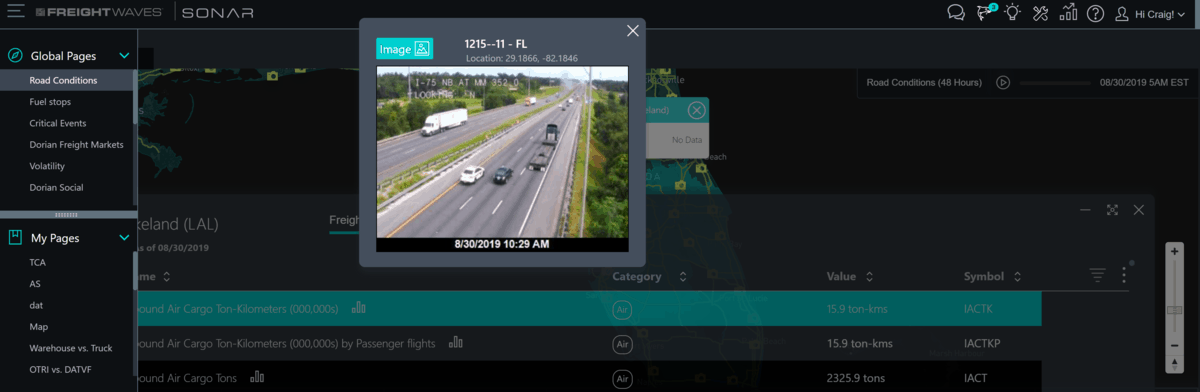
On the map feature, road and surface conditions allow users to see road conditions, surface precipitation, wind and wind gusts. SONAR also features road cameras that feed from DOT cameras.
In addition to the Dorian Freight Markets page, there is a ‘Dorian Social’ page directly underneath with up-to-the-minute Twitter feed information related to FEMA and the hurricane.
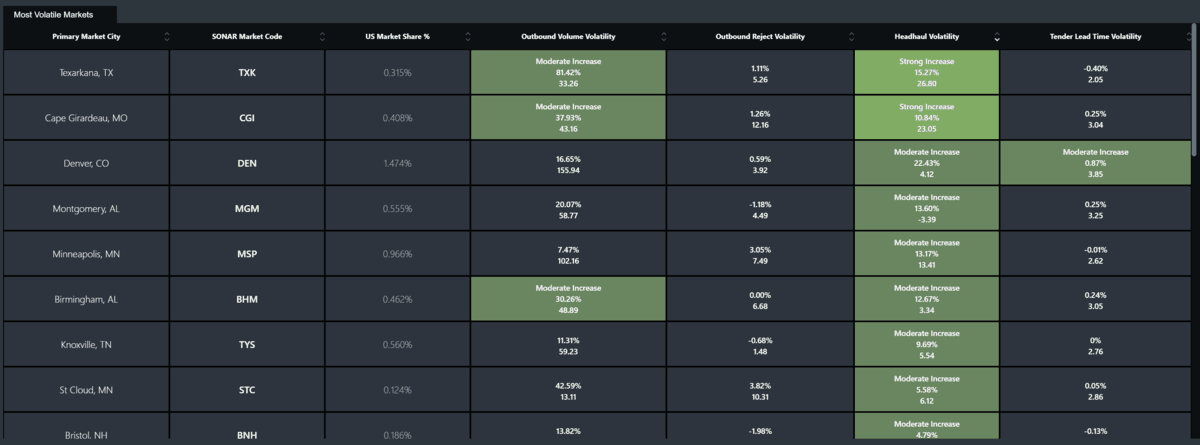
Hurricanes create massive amount of market volatility, which SONAR can help participants manage. There is a market volatility table on the page, which looks at volatility by market, using major indices which track things like tender rejection, volume, market share, and tender lead time.
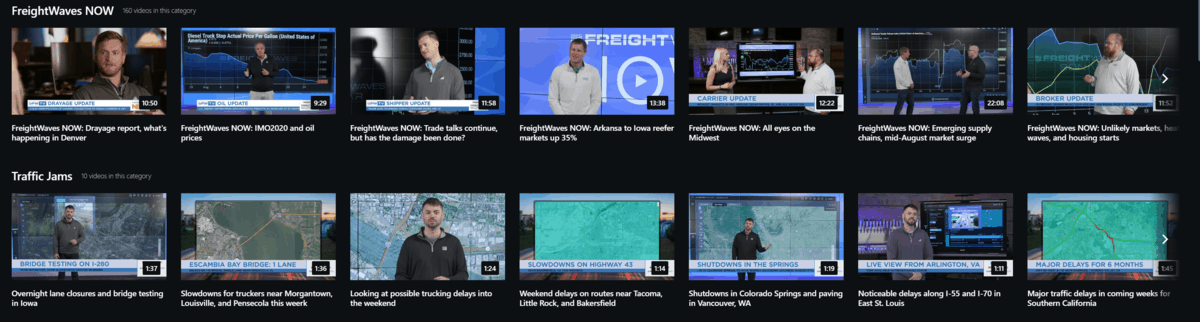
FreightWaves and other media content is available on the platform, where users can stay up to date with the latest published updates. There is a video widget, as well, that streams FreightWaves TV content directly on the desktop.
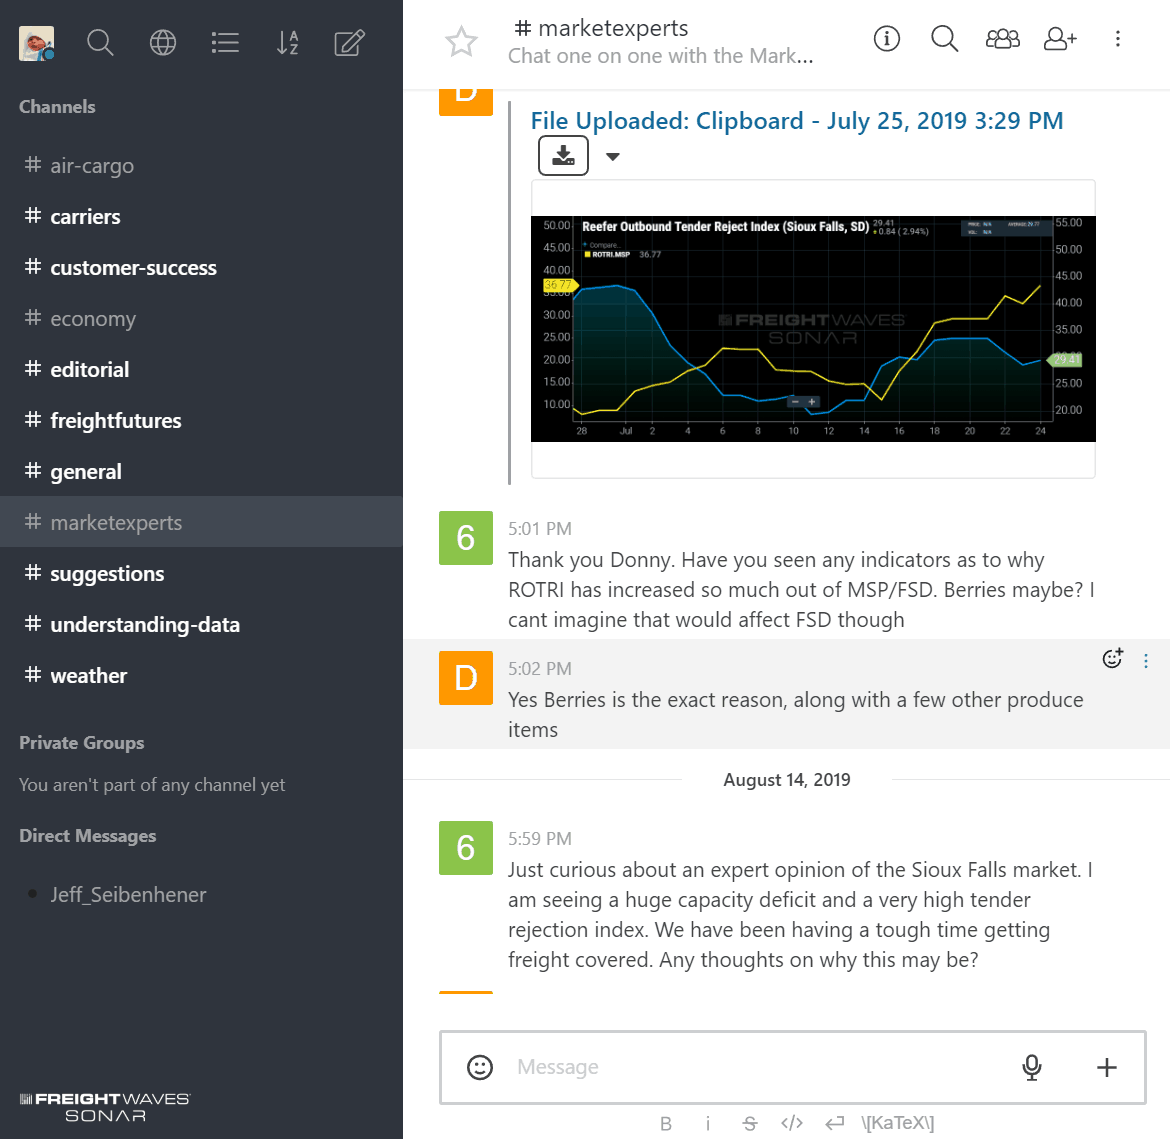
Also, participants can also connect directly with FreightWaves staff of market experts and meteorologists in the anonymous chat platform that is also apart of SONAR.
All usage of SONAR is governed by the SONAR user agreement.
Demetrio Serrano
Very interested to see how you guys work?